US Helicopter Accident Rate Analysis
Aerossurance recently looked at US Helicopter Emergency Medical Service (HEMS) accident data for the last 10 years and has also examined accident rates in Gulf of Mexico (GOM) oil and gas operations. We thought we would also look at published accident rates for all US helicopters and demonstrate the effects of choosing different start dates and different trending methods.
To look, initially, at performance during the 21st century we choose to use data from the International Helicopter Safety Team’s (IHST‘s) US regional team, the US Helicopter Safety Team (USHST). This is topical as this data has recently been discussed in a magazine article: What We Don’t Know Has Hurt Us. We then take a take a longer historic perspective back to 1970.
US Helicopter Fatal Accident Rates 2001-2015
In October 2015 the USHST published data for 2001-2015 (with the latter being a part year estimate) for fatal helicopter accidents per 100,000 flying hours.
We’ve plotted this data (excluded the partial 2015 results) and added a linear trend line (i.e. a best-fit straight line):
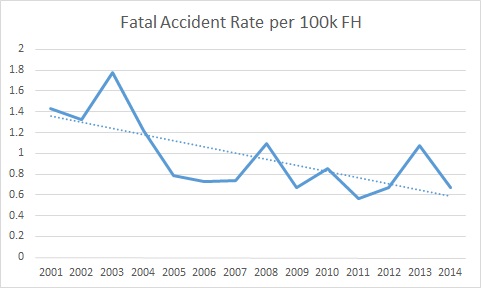
This shows an impressive improvement over the period. But what if we apply a rolling (or moving) average? A rolling average smoothes fluctuations to show a pattern or trend more clearly. If we choose a three year rolling average (i.e. we plot data based on the average of the last 3 years) then the results look very different:
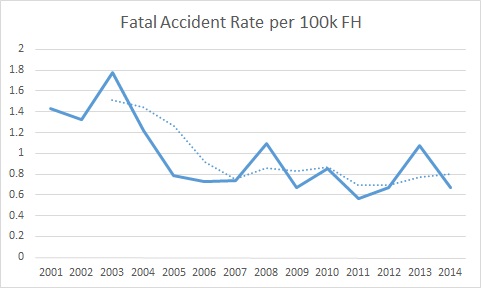
Here the poor start to the data set in 2001-2003 dominates the early rolling averages but in more recent years the data, while fluctuating, has essentially plateaued. Similar results are evident in 2 or 5 year rolling averages are selected.
If we were to choose a different start point, say 2006, the first year after the IHST was created, and revert to a linear trendline the results are even more dramatic:
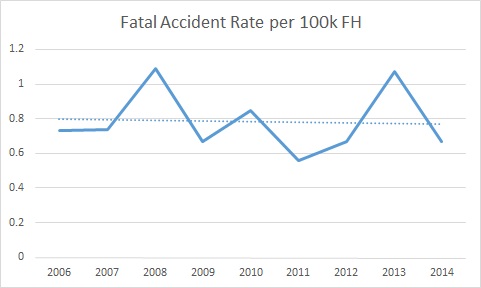
Almost no change in fatal accident rate over 9 years is evident.
If we use a 3 year rolling average:
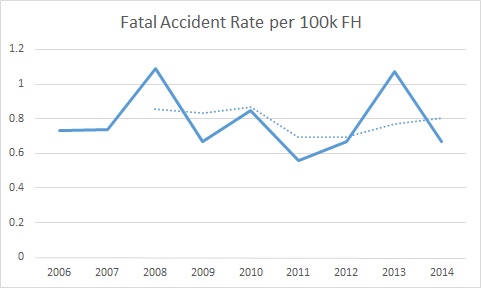
Here the rolling average has risen in recent years, very different to the liner trend.
US Helicopter Accident Rates 2001-2015
In October 2015 the USHST also published data for 2001-2015 for helicopter accidents (fatal and non-fatal) per 100,ooo flying hours. Unfortunately 2001-2005 is presented only as an average:
You will note that the USHST compare 2015 performance with the baseline 5 year average for 2001-20o5 (a 55% improvement). The 2015 data is however only 20% better than 2006.
We can plot average data for 2001-2005 and annual data for 2006-2014 (again ignoring the partial data for 2015) with a linear trend:
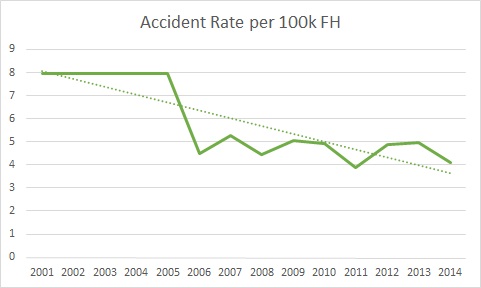
This shows a dramatic (over 50%) improvement. However, if we use a 3 year rolling average:
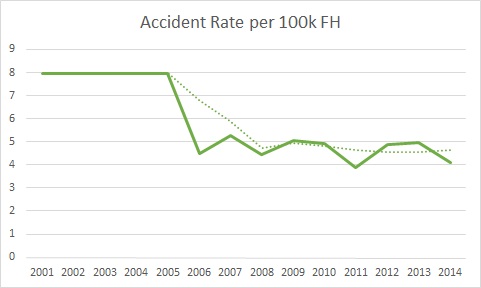
Here, although the trend reduces during the middle part of the last decade, in recent years the rate has again essentially plateaued.
If we focus just on 2006 onwards and apply a linear trend:
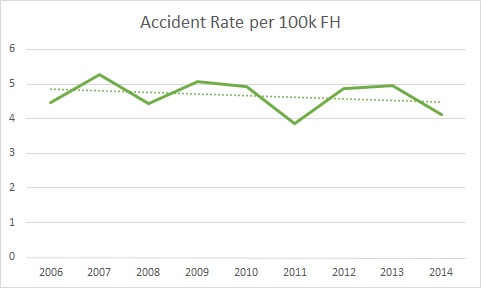
A modest improvement is evident over the period.
If we apply a 3 year rolling average:
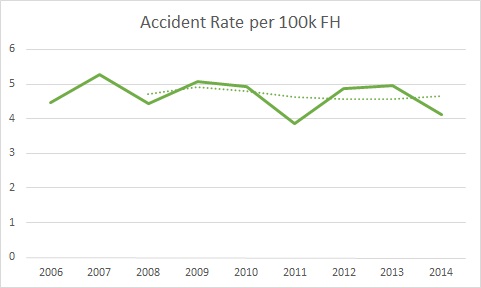
Very little improvement is now evident.
US Helicopter Accident Rates 1970-2013
To take a more historic perspective we have take data from the Helicopter Association International (HAI). There website contains data from 2001 to 2013 (we have taken the most recent record for each year to allow for any revisions as any new, mostly usage data, has emerged). In the Aerossurance achieves we have HAI published data back to 1970. This data is generally slightly more pessimistic than the USHST data (i.e. it assumes a slightly lower flying rate each year).
If we plot the fatal accident rate:
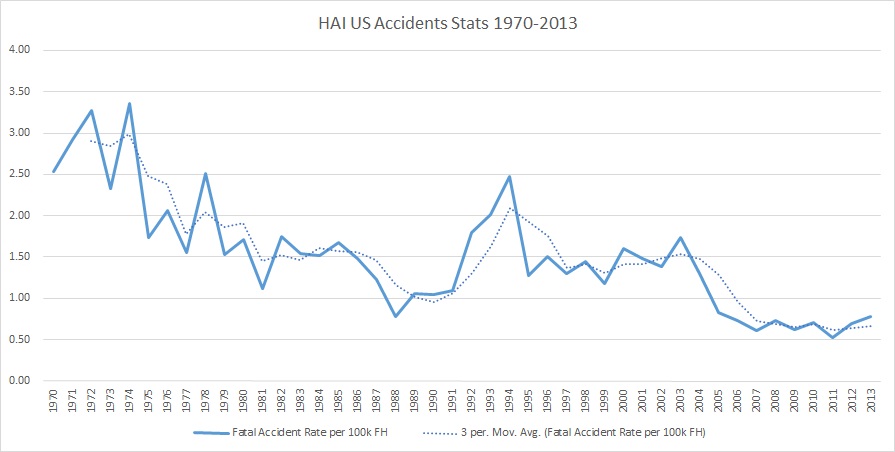
There is a falling trend during the 1970s and 1980s, a big spike up in the mid 1990s, a fairly steady 10 years and a sudden fall just before the IHST era, which, as we seen has been relatively steady, albeit at a historic low.
The rate for all US accidents can also be plotted:
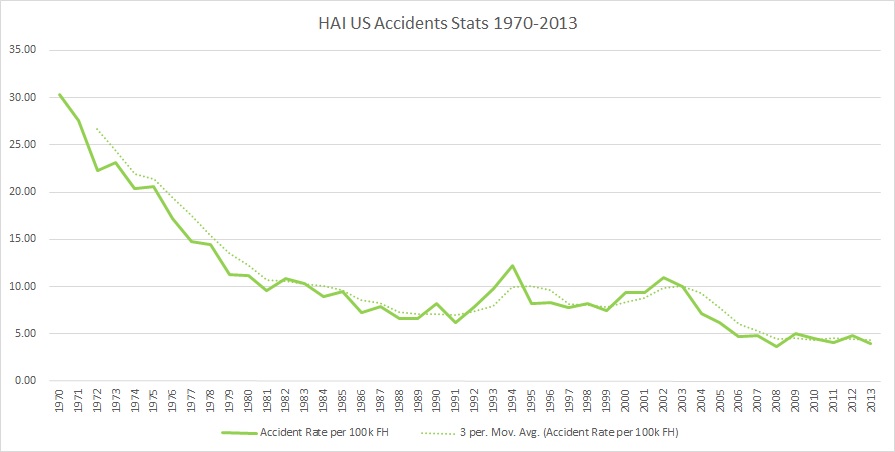
The spike in the early 1990s is less pronounced and again a steady decline in the first few years of this century has now plateaued.
You will also notice that the largest drop over 10 years was in the 1970s and was 63%, which demonstrates how ambitious the IHST originally was aiming for (80%).
Looking on this scale it is also clear that recent fluctuations year on year are trivial and that more fundamental.
We hope the above is useful in illustrating some of the challenges when presenting and interpreting safety data and for setting safety targets using lagging indicators such as accident rates.
Footnote
Mark Twain is said to have made famous a quote on statistics he attributed to 19th century British Prime Minister Benjamin Disraeli (although its authenticity has allegedly never been verified):
There are three kinds of lies: lies, damned lies and statistics.
A 20th century successor of Disraeli, Sir Winston Churchill, said:
Statistics are like a drunk with a lampost: used more for support than illumination.
In contrast we hope you found this piece illuminating!
You also may enjoy our article: Living Near Zero – New Challenges for Air Safety
UPDATE 15 August 2016: Also remember that data correlation does not automatically imply causality, as hilariously demonstrated by Vigen Tyler: Spurious Correlations
UPDATE 20 July 2016: The USHST have issued an encouraging update for the first six months of 2016.
The fatal accident rate for the first 6 months is 0.54 per 100k FH and the accident rate is 3.28 per 100k FH.
Note however: a) the flight hours for 2016 (and 2015) are based on FAA forecast data and b) no seasonal data for the first 6 months of other years is provided for comparison.
UPDATE 12 September 2016: The USHST has examined fatal accidents from 2009-2013:
Out of 104 fatal accidents that took place during the five-year span, 50 percent of them stemmed from three “occurrence” categories:
- Loss of Control while inflight — 19 fatal accidents;
- Unintended flight into instrument meteorological conditions (IMC) — 18 fatal accidents; and
- Low Altitude operations — 15 fatal accidents.
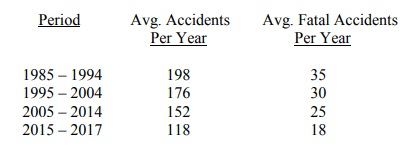
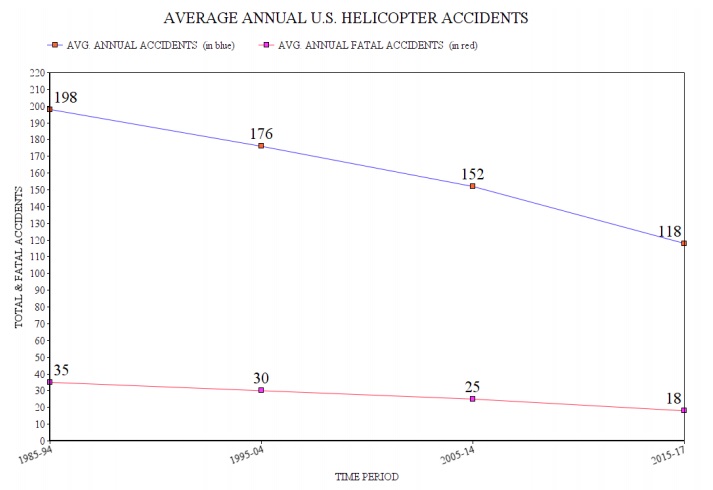
UPDATE 8 May 2018: The USHST say that:
Some peaks and valleys in the [accident] data have occurred during the three decades, including lower than expected accidents in 1988 and 1996, and a higher than expected number of accidents in 1990, 1994 and 2013.
When looking at the number of accidents in longer ten-year periods, total accidents per year have declined by 40 percent and fatal accidents have been nearly cut in half since the late 1980s.